NVIDIA’s $96.2B Quarter and the AI Infrastructure Boom: How to Read Revenue vs. Commitments

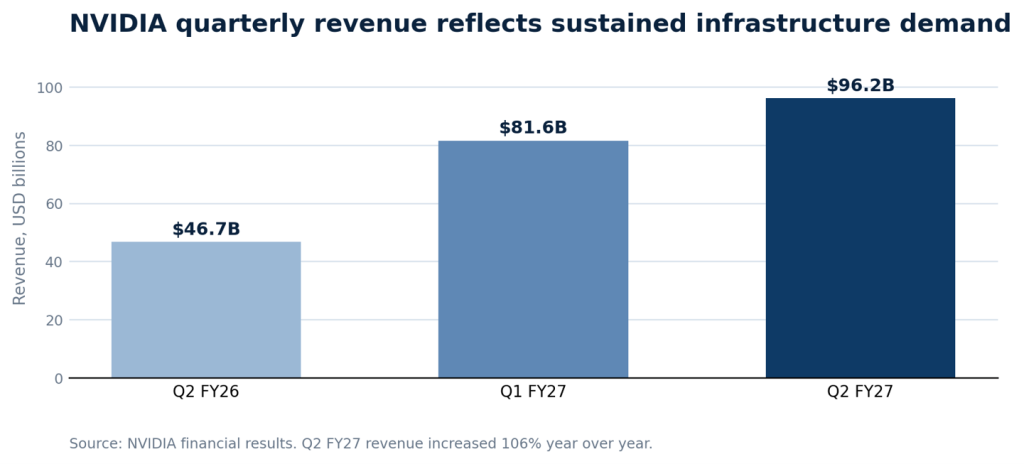
Figure 3. NVIDIA quarterly revenue. Company-reported financial results.
NVIDIA’s results are the strongest realized financial signal in the issue. Other large numbers describe different economic objects and should not be compared as if they were revenue. The distinction between recognized revenue, forecast revenue, purchase commitments, capacity reservations, contracted backlog, acquisition value, and IPO targets is essential.
| Development | Economic category | Amount or metric | Interpretation |
|---|---|---|---|
| NVIDIA Q2 FY27 | Recognized revenue | $96.2B total; $89.0B Data Center | Completed quarter; company financial report. |
| NVIDIA Q3 FY27 | Forecast | $108B, plus or minus 2% | Company outlook; not realized revenue. |
| AWS and NVIDIA | Planned capacity | Two million additional GPUs across 2027 and 2028 | Announced plan; deployment timing and utilization matter. |
| Anthropic and Nscale | Reported reservation | $45B over six years; about 460 MW reported | Reported by Reuters; commercial details not fully public. |
| Nscale | Reported contracted revenue | $103B cited in investor materials | Backlog-like measure; timing, concentration, and cancellation terms matter. |
| NVIDIA and Hugging Face | Acquisition value | $12.93B announced | Transaction value; subject to closing and integration risk. |
| OpenAI Jalapeño | Provider benchmark | 1.5 to 1.9 times work per watt in selected tests | Useful engineering signal; independent validation remains important. |